April 7, 2016
 Dr. Bill Hudson invited Nate Bander, Admission Outreach Coordinator, to share a blog post he wrote about how MPA faculty members use maps in their classrooms.
At Mounds Park Academy, students learn how maps tell a story.
Take, for example, a map that plots the mean center of the population of the United States from the first census in 1790 to the 1940 census at the dawn of the second world war.
In 1790, the mean center of population rested comfortably in Kent County, 23 miles east of Baltimore Maryland. Makes sense, right? Most of the population recorded in the census resided on the eastern seaboard.
Fast forward 150 years. The mean center of population has pushed 603 miles to the southwest, landing precariously in Carlisle, Indiana, waiting to leap across the border into Illinois on its southwesterly march.
In 2015, the mean center of population reached the Missouri Ozarks, sliding another 288 miles to the southwest.
This map tells us something. It’s the story of the United States. It’s the story westward expansion. It’s the story manifest destiny. It’s the story of migration.
Telling a story of global proportions
The Peters world map tells a story too. First debuting in 1974, it made its way into more and more classrooms as criticisms of the continuing imperialist attitudes in Eurocentric world maps mounted.
Mounds Park Academy faculty, knowing that different maps tell different stories, make a conscious effort to incorporate a variety of different world maps to tell a variety of different stories. These include The Peters world map, the Mercator world map, the Winkel world map, the Robinson world map, the Van Der Grinten world map and various globes.
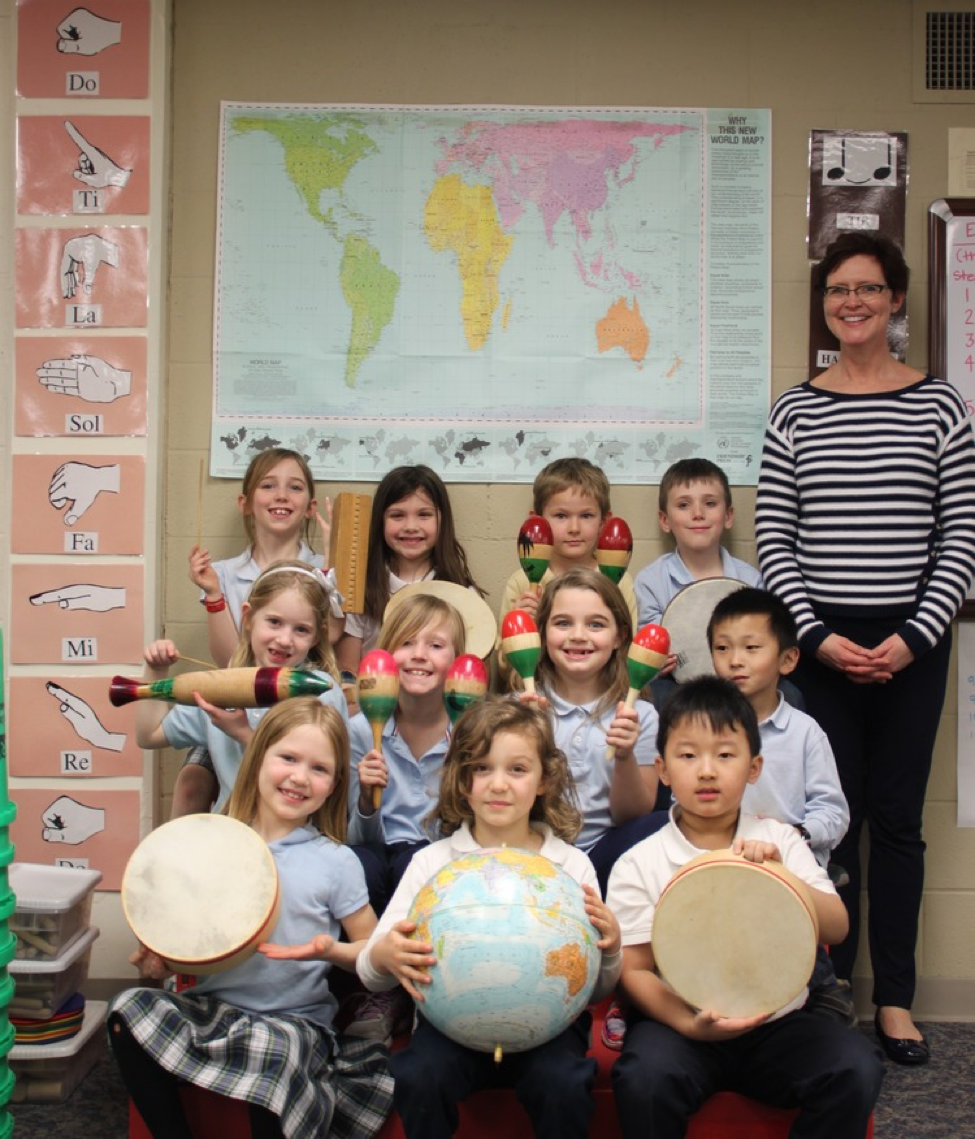
For lower school music teacher Mari Espeland, it is very important that students experience music from around the world. “Listening lessons include music from varied times and places. Showing the students, or having them locate, the music’s place of origin helps to establish context,” notes Espeland.
As lower school students begin to understand their place in the world, Espeland finds herself asking questions like “Where are we?” and “Where are we in relationship to this other place?” She uses the Peters world map on the wall in her classroom to help answer her budding musicians’ frequent questions.
“The Peters projection more accurately represents land mass,” she says, “The students can see a world that does not make the United States huge and in the middle. When we find countries in Africa (this year we have learned several musical pieces from Ghana and Tanzania) the students search on a large, centrally located continent.” Adding, “For all of my students, but especially the visual learners, representing the world in a more equitable way is important for their growth and understanding.”
Upper School Spanish teacher Marisue Gleason teaches with an upside down world map as well as a Peters world map. “I use them for reference points, for different ways of looking at the (sometimes upside down) world,” she says. “Especially with the Peters world map, I talk about the latitude lines and how that influences the actual size of countries and continents. When Students come to the upper school, they have seen a lot of different maps, but they don’t always remember what each map is called.”
A map that can travel
In February, Mounds Park Academy partnered with National Geographic to bring a 26×35 ft. map of South America to campus. This map, an Azimuthal equidistant projection, stayed on campus for two days, affording nearly every student the opportunity to get down on hands and knees to closely examine each feature and detail on the map, spread out over half of a basketball court.
Middle School Spanish teacher Kevin Hagen took students in his classes to see the map. “It’s really important to have students see how the geography and land formations influence the culture of Spanish-speaking countries,” he says. “We paired the map activity with a presentation about South America where they got to see more images of key locations and animals on the continent.”
Different Stories
Including a variety of maps in the classroom creates different ways of learning about the world. Just as the mean center of population map told the story of a burgeoning westward expansion, the varying maps of the world tell different stories about the Earth.
“We try and show our students a variety of different world maps because each map shows a different perspective. We challenge our students to think about the inherent biases of each map and acknowledge that even the best map distorts. It’s impossible to portray a 3D spherical object on a 2D piece of paper,” says fourth grade teacher Yamini Kimmerle.
At Mounds Park Academy, maps represent an incredible lens through which to think critically and globally. They dot the walls of every classroom in the school, each an essential piece in the pursuit of the joy of learning.